Introduction
Analysis of one variable is very powerful, but most of the time, functions will have several variables.
This series will cover analysis in several variables.
Formal definition
Let’s properly define what a function of several variables is
A function of two variables is a rule that associates to each pair, $(x, y)$ of real numbers, in a set, $D$, a unique number denoted as, $f(x, y)$.
$D$ is the so-called domain. The domain is the allowed values of our variable parameters.
The range of $f$, is the set of all values that $f$ can take.
$$ \{ f(x, y) \ | \ (x, y) \in D \} $$
Example
$$ f(x, y) = \dfrac{x^3 y}{y - 1} $$
Range: $$ \{ f(x, y) \ | \ y - 1 \neq 0 \} $$
Domain: $$ \{ (x, y) \ | \ y \neq 1 \} $$
Graphs
Let’s define graphs in several variables.
Definition
The graph of a function of two variables is the set of all points, $(x, y)$, which, $(x, y) \in D$.
In other words, it’s a surface with equation: $$ z = f(x, y) $$
Example
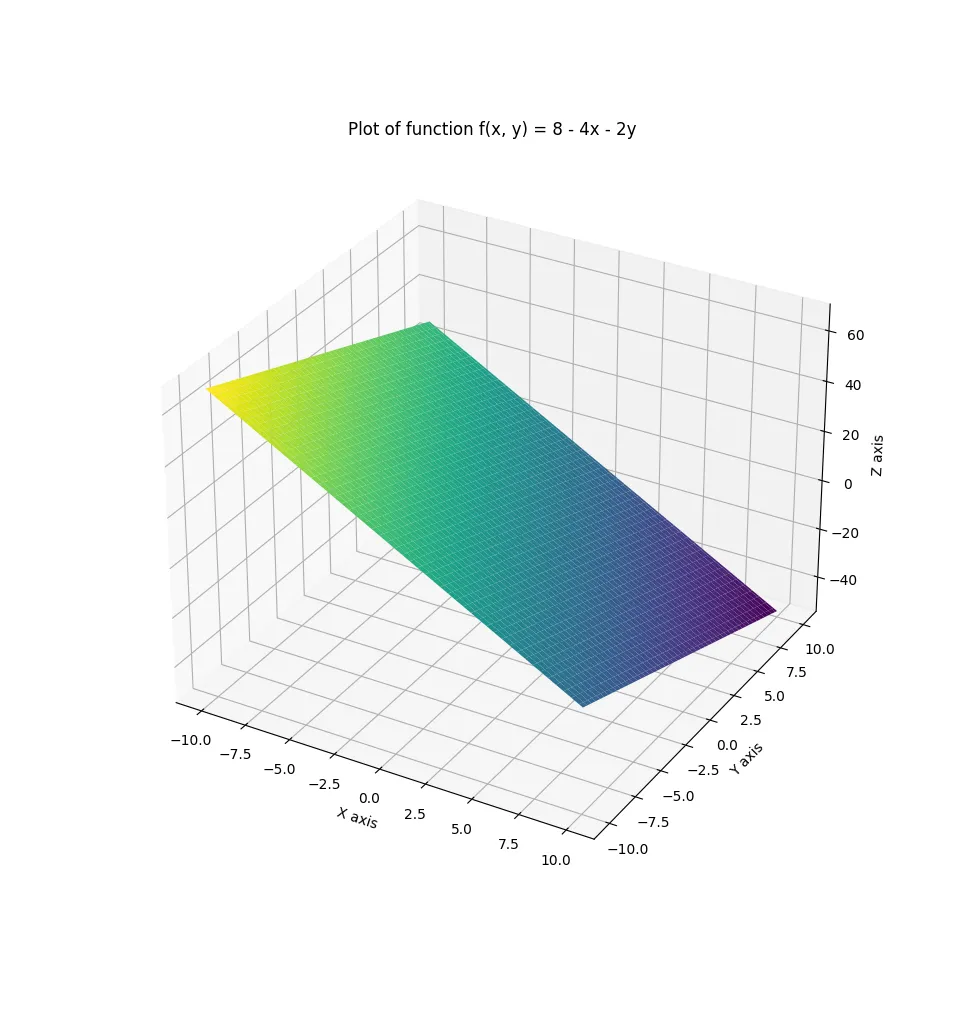
Evaluate $f(0, 4)$ and graph the surface.
$$ f(x, y) = 8 - 4x - 2y $$
$$ f(0, 4) = 8 - 0 - 8 = 0 $$

Level curves
Level curves are a very important topic when dealing with several variables.
Definition
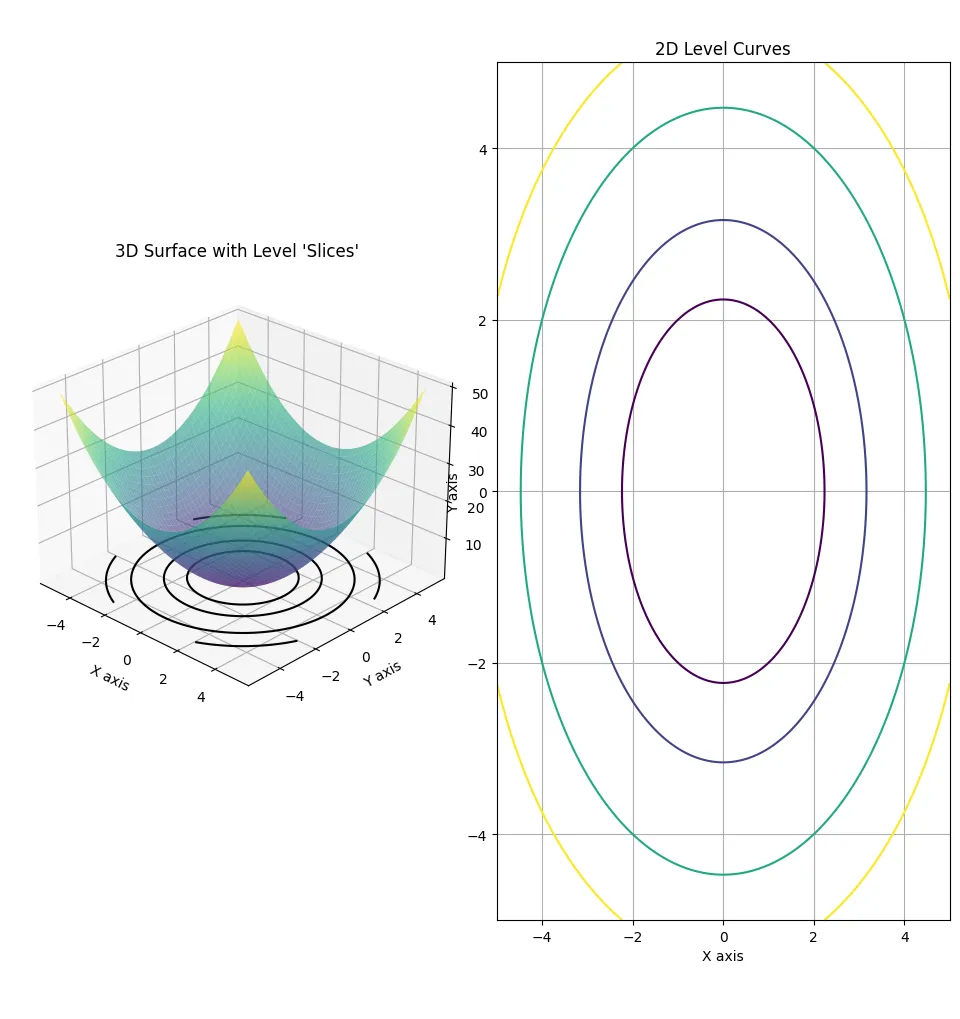
The level curves of a function of two variables are the curves with the equation:
$$ f(x, y) = k, \text{where $k$ is constant} $$

Example
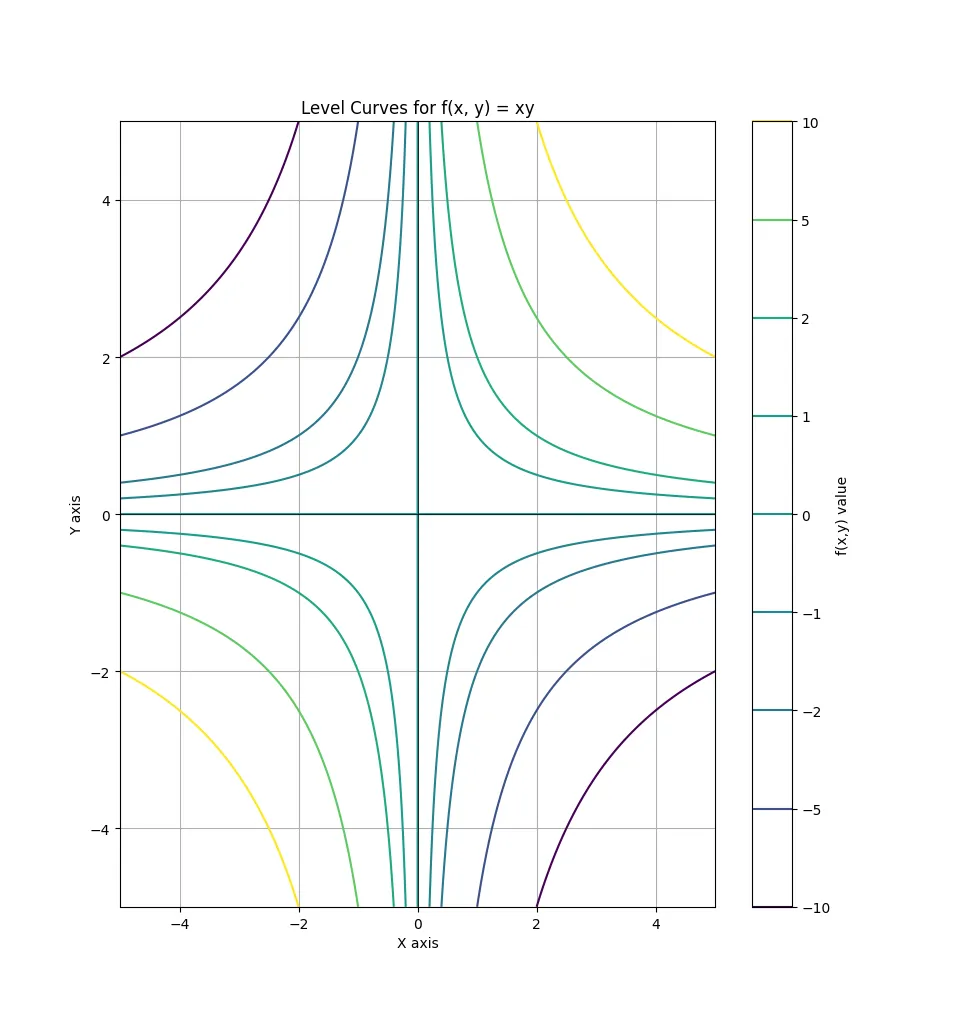
Sketch the level curves for $f(x, y) = xy$
Case $k = 0$: $$ xy = 0 \ | \ \text{$x = 0$ or $y = 0$} $$
Case $k \neq 0$: $$ xy = k \ | \ \text{$x = \dfrac{k}{y}$ or $y = \dfrac{k}{x}$} $$
If we plot for different k values:

Limits
Let’s compare limits in one variable to several. $$ \lim_{x \to a} f(x) = L $$
$$ \lim_{(x, y) \to (a, b)} f(x) = L $$
They work quite similiar, let’s see the limit laws:
$$ \lim_{(x, y) \to (a, b)} f(x, y) \pm h(x, y) = L + M $$
$$ \lim_{(x, y) \to (a, b)} f(x, y) \cdot h(x, y) = L \cdot M $$
$$ \lim_{(x, y) \to (a, b)} \dfrac{f(x, y)}{h(x, y} = \dfrac{L}{M} , M \neq 0 $$