Introduction
Analysis of one variable is very powerful, but most of the time, functions will have several variables.
This series will cover analysis in several variables.
Let’s properly define what a function of several variables is
Definition 1 (Function of two variables)
A function of two variables is a rule that associates to each pair, (x,y) of real numbers, in a set, D, a unique number denoted as, f(x,y).
D is the so-called domain. The domain is the allowed values of our variable parameters.
The range of f, is the set of all values that f can take.
{f(x,y)∣(x,y)∈D}.Example 1
f(x,y)=y−1x3y.Range:
{f(x,y)∣y−1=0}.Domain:
{(x,y)∣y=1}.Graphs
Let’s define graphs in several variables.
Definition 2 (Graph)
The graph of a function of two variables is the set of all points, (x,y), which, (x,y)∈D.
In other words, it’s a surface with equation:
z=f(x,y).Example 2
Evaluate f(0,4) and graph the surface.
f(x,y)=8−4x−2y.f(0,4)=8−0−8=0.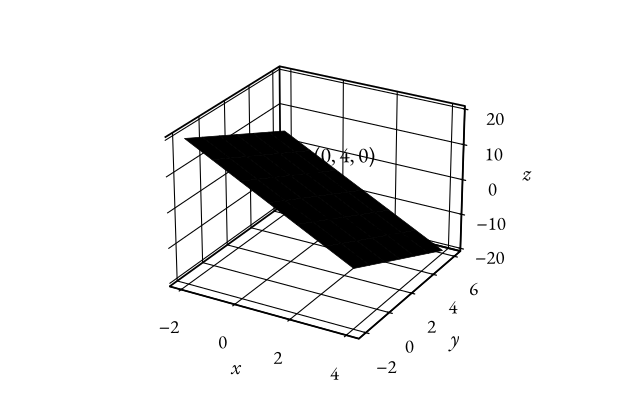 Figure 1: The plane z=8−4x−2y through (0,4,0).
Level curves
Level curves are a very important topic when dealing with several variables.
Definition 3 (Level curves)
The level curves of a function of two variables are the curves with the equation:
f(x,y)=k,where k is constant.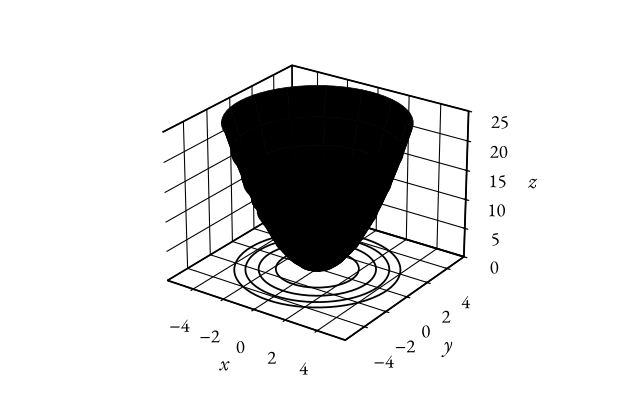 Figure 2: Level curves of z=x2+y2, on the surface and projected onto the xy-plane.
Example 3
Sketch the level curves for f(x,y)=xy
Case k=0:
xy=0∥x=0 or y=0.Case k=0:
xy=k∥x=yk or y=xk.If we plot for different k values:
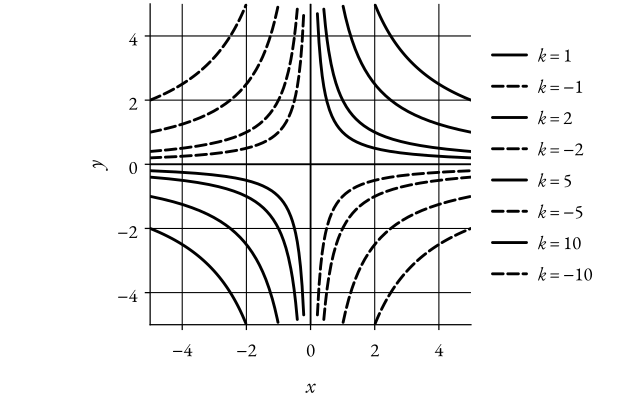 Figure 3: Level curves xy=k.
Limits
Let’s compare limits in one variable to several.
x→alimf(x)=L,
(x,y)→(a,b)limf(x,y)=L.
They work quite similar, let’s see the limit laws:
(x,y)→(a,b)limf(x,y)±h(x,y)=L±M,
(x,y)→(a,b)limf(x,y)⋅h(x,y)=L⋅M,
(x,y)→(a,b)limh(x,y)f(x,y)=ML,M=0.